概要
qPCR is used to determine changes in steady-state mRNA levels of gene expression across multiple samples, generally normalized to the relative expression of internal control genes. Gene-specific primers amplify target sequences within cDNA pools reverse-transcribed from mRNA and, as with TaqMan® technology, hybridized sequence-specific probes provide a fluorescent signal from the 5' exonuclease activity of Taq DNA polymerase. The accumulation rate of the fluorescent signal is used to quantify the sample cDNA, and thereby the amount of mRNA in the original cell lysate.
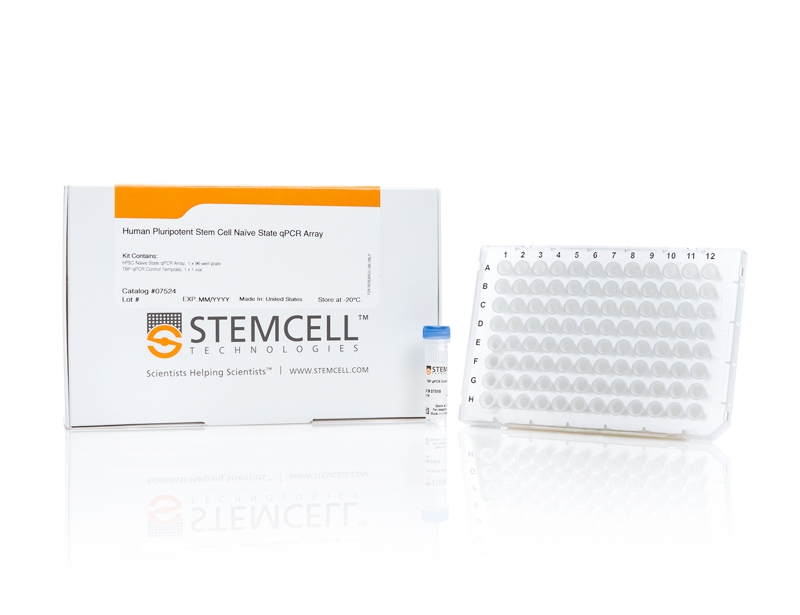
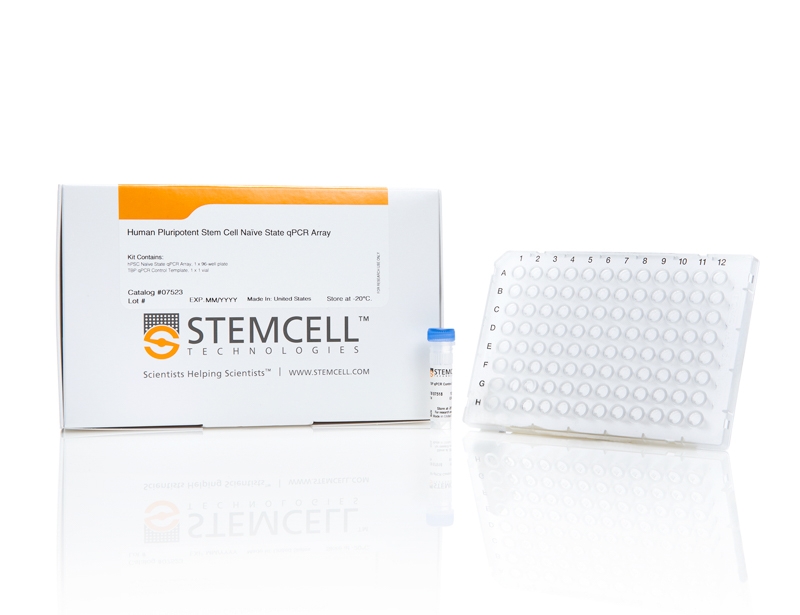
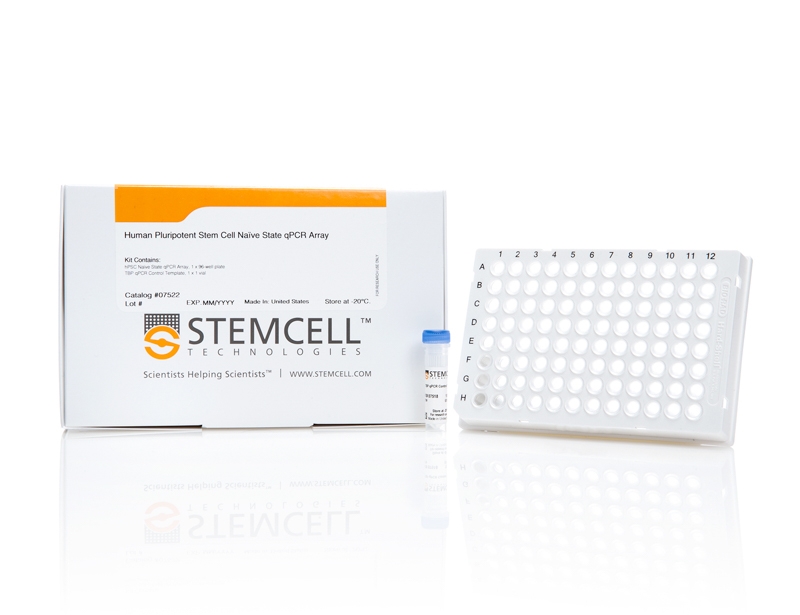
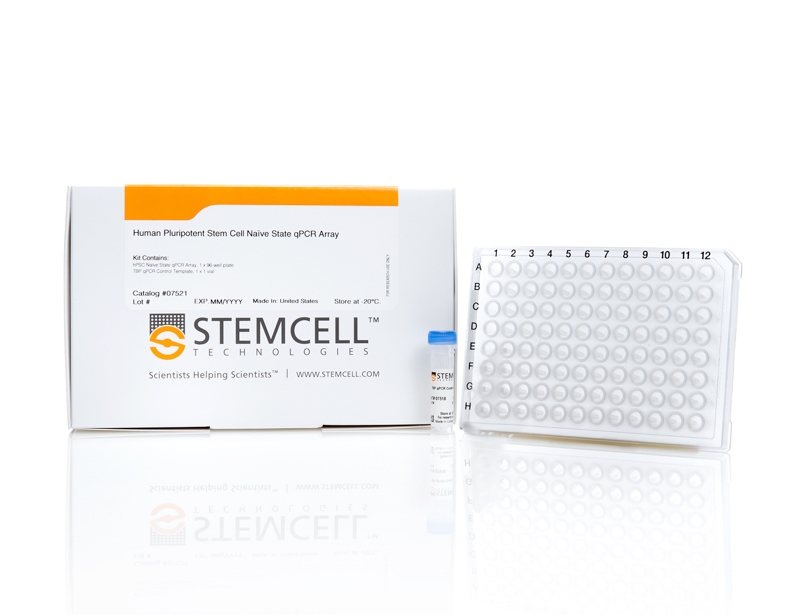
This qPCR array contains validated primers and probes for detection of 90 genes whose expression is correlated with naïve and primed PSCs and their derivatives, as well as 6 endogenous (housekeeping) control genes. TBP (TATA box-binding protein) qPCR Control Template is provided as a synthetic DNA positive control. Additional gene information and a qPCR analysis tool are available at www.stemcell.com/qPCRanalysis
技术资料
| Document Type | 产品名称 | Catalog # | Lot # | 语言 |
|---|---|---|---|---|
| Product Information Sheet | Human Pluripotent Stem Cell Naïve State qPCR Array | 07521, 07523, 07524 | All | English |
| Safety Data Sheet 1 | Human Pluripotent Stem Cell Naïve State qPCR Array | 07521, 07523, 07524 | All | English |
| Safety Data Sheet 2 | Human Pluripotent Stem Cell Naïve State qPCR Array | 07521, 07523, 07524 | All | English |
| Safety Data Sheet 3 | Human Pluripotent Stem Cell Naïve State qPCR Array | 07521, 07523, 07524 | All | English |
| Safety Data Sheet 4 | Human Pluripotent Stem Cell Naïve State qPCR Array | 07521, 07523, 07524 | All | English |
| Safety Data Sheet 5 | Human Pluripotent Stem Cell Naïve State qPCR Array | 07521, 07523, 07524 | All | English |
数据及文献
Data
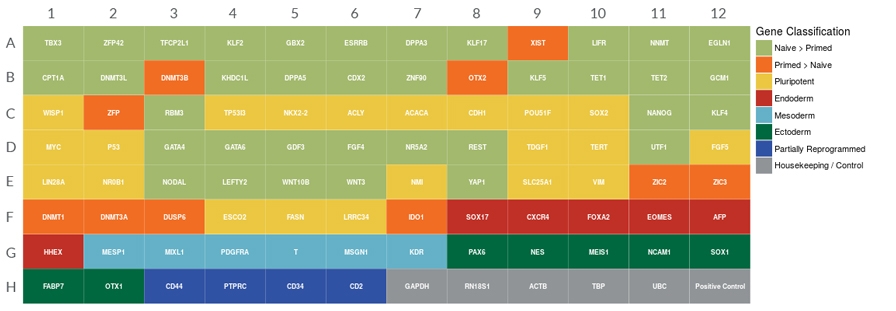
Figure 1. Human Pluripotent Stem Cell Naïve State qPCR Array Plate Configuration
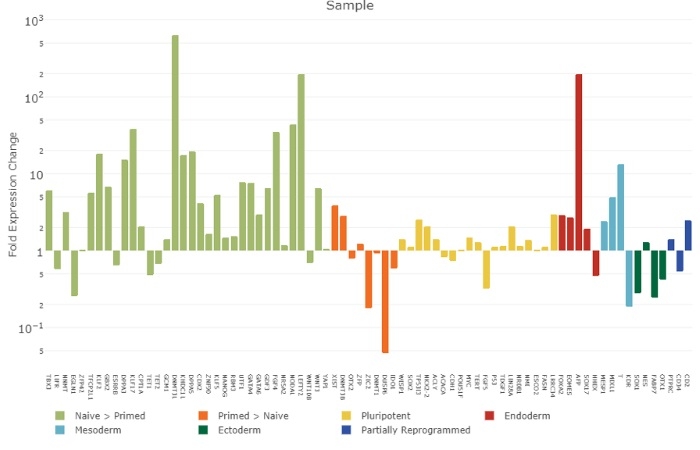
Figure 2.
Quantitative PCR analysis of gene expression of H1 hESCs cultured in a naive-like state compared to H1 hESCs cultured under a primed state. Genes associated with higher expression in a naive state than a primed state are shown in light green, genes expected to be more highly expressed in a primed state compared to a naive state are shown in orange and pluripotency associated genes expressed highly in both naive and primed states are shown in yellow. Genes associated with endoderm (red), mesoderm (light blue) ectoderm (dark green) and partially reprogrammed genes (dark blue) in feeder-free versus feeder-dependent tissue culture are also show. Y-axis measures the log change expression difference and X-axis indicates the name of the gene. Experiments were run on a Viia7 Fast (Applied Biosystems) Instrument and data analysis was performed using STEMCELL qPCR analysis program (www.stemcell.com/qPCRanalysis).

 网站首页
网站首页
