概要
The simple, 12-day differentiation protocol is performed in two stages. During the first 3 days, STEMdiff™ Hematopoietic Supplement A is added to the basal medium to induce cells toward mesoderm. For the subsequent 9 days, mesodermal cells are further differentiated into hematopoietic progenitor cells using basal medium supplemented with STEMdiff™ Hematopoietic Supplement B. At the end of the 12-day protocol, hematopoietic cells can be easily harvested from the culture supernatant. This population typically contains 25 - 65% (average 43%) CD34+CD45+ progenitor cells, including progenitor cells that have the capacity to form hematopoietic colonies in the colony-forming unit (CFU) assay.
STEMdiff™ Hematopoietic Kit has been optimized for differentiation of cells maintained in mTeSR™1 (Catalog #85850), mTeSR™ Plus(Catalog #100-0276), or TeSR™-E8™ (Catalog #05990).
技术资料
| Document Type | 产品名称 | Catalog # | Lot # | 语言 |
|---|---|---|---|---|
| Product Information Sheet | STEMdiff™ Hematopoietic Kit | 05310 | All | English |
| Safety Data Sheet 1 | STEMdiff™ Hematopoietic Kit | 05310 | All | English |
| Safety Data Sheet 2 | STEMdiff™ Hematopoietic Kit | 05310 | All | English |
| Safety Data Sheet 3 | STEMdiff™ Hematopoietic Kit | 05310 | All | English |
数据及文献
Data

Figure 1. Hematopoietic Differentiation Protocol
On Day -1, harvest and seed human ES/iPS cell colonies as small aggregates in mTeSR™1, mTeSR™ Plus, or TeSR™-E8. After one day, TeSR™ medium is replaced with Medium A (STEMdiff™ Hematopoietic Basal Medium containing Supplement A) to begin inducing the cells towards a mesoderm-like state (day 0). On day 2, a half medium change is performed with fresh Medium A. On day 3, the medium is changed to Medium B (STEMdiff™ Hematopoietic Basal Medium containing Supplement B) with half medium changes on days 5, 7 and 10, to promote further differentiation into hematopoietic cells. Typically, by day 12, large numbers of HPCs can be harvested from the culture supernatant.
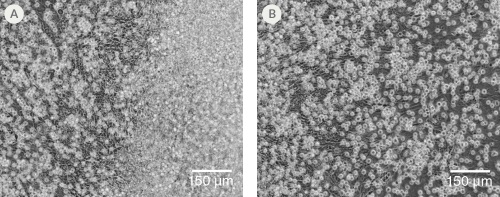
Figure 2. Morphology of hPSC-Derived HPCs
Representative images of (A) hES (H1) cells and (B) hiPS (WLS-1C) cells on Day 12 of differentiation to HPCs using the STEMdiff™ Hematopoietic Kit. Differentiated cells exhibit typical HPC morphology as round cells that float freely in suspension.
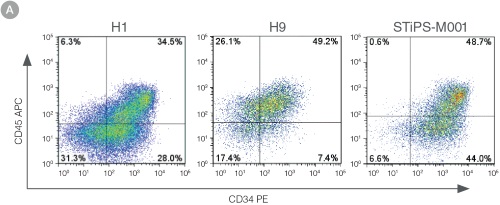
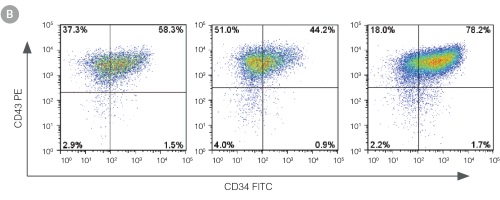
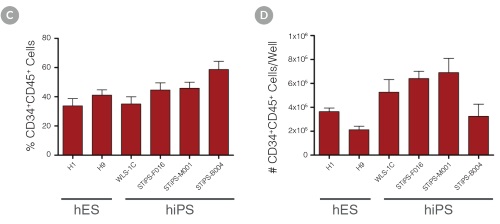
Figure 3. Efficient and Robust Generation of CD34+CD45+/CD43+ HPCs
hES and hiPS cells were cultured for 12 days in single wells of 12-well plates using the STEMdiff™ Hematopoietic Kit. At the end of the culture period, cells in suspension were harvested and analyzed by flow cytometry for expression of hematopoietic cell surface markers: CD34, CD45 and CD43. (A,B) Example flow cytometry plots for hematopoietic cell surface-marker analysis of cultures of hES (H1 and H9) and hiPS (STiPS-M001) cells. (C,D) Percentages and total numbers of CD34+CD45+ cells in cultures of hES (H1 and H9) or hiPS (WLS-1C, STiPS-F016, STiPS-M001 and STiPS-B004) cells are shown. Data shown as mean ± SEM; n ≥ 3.
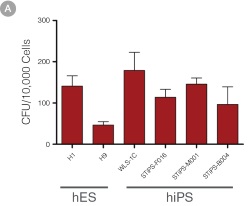
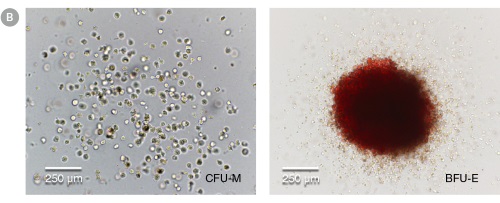
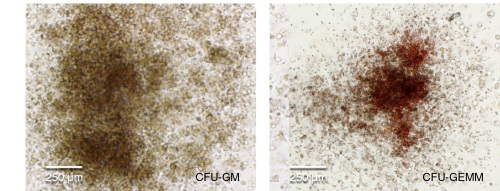
Figure 4. hPSC-Derived HPCs Produce Colonies of Multiple Lineages
Cells in suspension were harvested from the cultures on Day 12 of the hematopoietic differentiation protocol and assessed in colony-forming unit (CFU) assays using MethoCult™ H4435 Enriched (Catalog #04435) methylcellulose-based medium. (A) CFU frequencies in cultures of 6 different hPSC lines. (Data shown as mean ± SEM; n ≥ 3.) The CFU frequencies were variable between the different cell lines, with on average approximately 120 CFU per 10,000 hPSC-derived HPCs plated. (B) The progenitor cell types observed included granulocyte/macrophage (CFU-M, CFU-G and CFU-GM), erythroid (BFU-E and CFU-E) and occasional mixed (CFU-GEMM) colonies. Representative colony images are shown at 40X magnification.

Figure 5. Generation of Hematopoietic Progenitor Cells from hPSCs Maintained in mTeSR™ Plus
Human ES (H1, H9) and iPS (STiPS-M001, WLS-1C) cell lines maintained in mTeSR™1 (daily feeds) or mTeSR™ Plus (restricted feeds) were differentiated to hematopoietic progenitor cells using the STEMdiff™ Hematopoietic Kit. At the end of the differentiation period, cells were harvested from the supernatant and analyzed by flow cytometry for co-expression of CD34+ and CD45+ . (A) Representative density plots showing CD34+ and CD45+ expression, (B) percentage of cells co-expressing CD34+ and CD45+ , and (C) total number of viable cells harvested are shown. Data are expressed as the mean (± SEM); n=4.

 网站首页
网站首页

